Contents.
Microbiology lab practical part 1. The 2nd-3rd weeks of the semester.
Microbiology lab practical part 2. The 4th-5th weeks of the semester.
Microbiology lab practical part 3. The 6th-7th weeks of the semester.
Microbiology lab practical part 1. The 2nd-3rd weeks of the semester.
Microbiology lab practical part 2. The 4th-5th weeks of the semester.
During your previous practice, you tried to isolate a pure bacterial culture from a clinical sample using the streak plate method. Now the microbial taxonomic identification of such pure culture will be performed.
In clinical microbiology the microbial identification is often based on phenotypic methods. Phenotypic identification methods include the study of the biochemical profile and metabolic properties of a microorganism by testing its growth requirements, and enzymatic activities. Mass spectrography can be alternatively used to detect specific spectrum of the bacterial proteins.
The biochemical tests use specific growth media, nutrients, chemicals or growth conditions to elicit an observable or measurable biochemical response from the microorganism, thereby enabling its identification and characterization. These tests include: utilization of carbon and nitrogen sources, growth requirements (anaerobic or aerobic; temperature-optimum and range, pH optimum and range), generation of fermentation products, production of enzymes. Examples of recognized tests include: phenol red carbohydrate, catalase and oxidase tests, oxidation-fermentation tests, methyl red tests, Voges-Proskauer tests, nitrate reduction, starch hydrolysis, tryptophan hydrolysis, hydrogen sulfide production, citrate utilization, litmus milk reactions, etc.
Several miniaturized and automated commercial systems are currently available with well-defined quality control procedures that allow for rapid identification of microorganisms.
During your practicals you will indentify the strain of gramnegative glucose-fermenting facultative anaerobic bacteria isolated from urine sample which according to preliminary tests belongs to family Enterobacteriaceae. The system "Enterotest 24N" will be used. See also Enterotestletak.pdf from pg.9.
FIRST DAY
Preparation of inoculum:
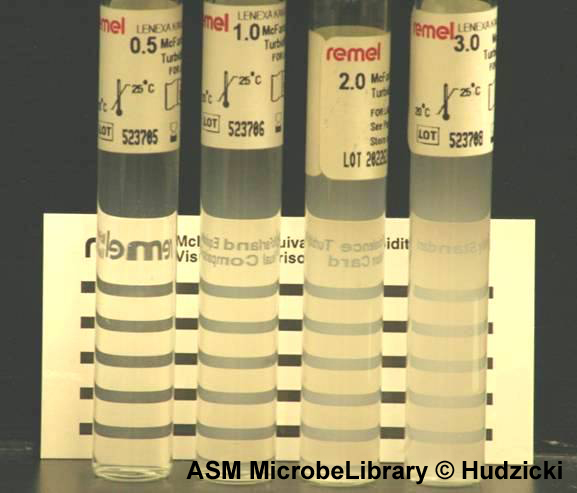
• Using a loop prepare a suspension in saline solution from a 24 hour bacterial culture. The suspension must have turbidity equal to No.1 of McFarland turbidity scale. (Standards will be in the laboratory). The suspension of less or more turbidity can cause false reactions! Homogenise the suspension well.
Preparation of ENTEROtest 24 N plate:
- Open an alluminium bag by cutting it close to the weld and take our a plate.
- Cut off a required number of strips using a scalpel (24 tests in three rows are designed for identification of one strain).
- Remove the adhesive aluminium foil from the prepared strip and insert it into an empty frame.
Inoculation:
- Homogenise the bacterial suspension well. The best is to use a Vortex.
- Inoculate 0.1 ml of the suspension into all wells of a strip.
- Add 2 drops of paraffin oil into the first five wells of the first row (H, G, F, E and D with the tests URE, ARG, ORN, LYS, H2S ). The lid is labelled by a graphic symbol (a dot ) for the tests with added paraffin oil.
Incubation:
- Insert the frame with inoculated strips into a polyethylene bag.
- Fold the open end of the bag under the plate to prevent evaporation during the incubation.
- Insert the plate of ENTEROtest 24 N into an incubator set up for 37 °C. Incubate it for 24 hours.
Additional test for Indole production:
Material required:
• Pipette with sterile tips, filter paper (e.g. Whatman N. 1)
• Inoculation loop, marking pen etc.
Recommended procedure:
• Use a 18-24-hour culture from a culture medium containing tryptone (tryptophane), preferably blood agar.
• Add a drop of the solution INDOLtest on a piece of filter paper so that the paper is sufficiently wet.
• Using an inoculation loop smear few colonies of the tested culture onto the drop zone on the filter paper. The paper must not dry out before the bacterial colonies are applied.
• Incubate at ambient temperature for 2 to 5 minutes.
• Evaluate the colour reaction directly on the drop zone according to the table Interpretation of the reaction.
Interpretation of the reaction. Reaction/Colour expression:
SECOND DAY
Evaluation:
Identification:
• Use the identification program TNW, GIDEON database, or eventually the Code Book for the ENTEROtest 24 N results interpretation.
How the computerized identification works? Program uses probabilistic identification matrices (frequency matrices - simple example is here: matice.htm). Using known (published) frequencies of positivity of given tests in all bacterial species the program identifies the strain and calculates the identification reliability. Bacteria are haploid organisms and often change some phenotypic properties. For such organisms the probabilistic method of identification is optimal.
You will need your notebooks.
You can download TNW programme here: setup.zip . Extract the zip file, rename the file setup.dat to setup.exe and run this exe file. It will install evaluation (30days TNW) software on your computer. It is also possible to install it during your practicals or even not to install it at all and use the PC at the blackboard instead. TNW is optimal for Enterotest results evaluation. See: tnw.wmv
Code book is here: Enterotest.pdf . Using a profile index and search engine of Acrobat Reader you can get pre-calculated result of the given combination of positive and negative tests.
Gideon - Microbiology module can analyze your Enterotest data.
The result of strain identification is similar in TNW, Gideon, and Code book.
Gideon can also help you to make the correct probabilistic clinical diagnose of an infectious disease. Frequency matrices contain percentages of positivity of symtoms in different diseases. The probable diagnose is calculated using the same mathematical formulas as in microbiology module.
To demonstrate a rapid microbiological diagnostics you will also perform the direct immunological identification of Streptococcus pyogenes on the throat swab using the StrepA diagnostic kit.
For the rapid identification of some clinically important bacteria from the sample Lateral flow immunoassay is used. (It is widely used for the detection of Streptococcus pyogenes in the throat swab, Clostridium difficile toxins in stools, bioweapons etc.).
The principle is described here: http://www.cytodiagnostics.com/store/pc/Lateral-Flow-Immunoassays-d6.htm .
Instructions for StrepA kit are here: qustick strep a.pdf. Leaflet is here: strep a.pdf
The FIRST DAY students will receive swabs already dipped into the different bacterial suspensions (do not use them for your own throat swab!!!). Students will slightly touch the blood agar with the swab before the Strep A procedure, streak the plate and place it into the incubator. Then they will use the Strep A kit for rapid Streptococcus pyogenes detection in the same swab (streptococcus will be not always present).
On the SECOND DAY the control culture will be checked.
Microbiology lab practical part 3. The 6th-7th weeks of the semester.
During your previous practice, you tried to identify the unknown baterial strain. Now the antibiotic sensitivity testing of such strain will be performed.
Antibiotic sensitivity testing
This is abbreviated and modified text of Jan Hudzicki.
History
The publication on penicillin by Alexander Fleming in 1928 is a milestone in the history of medicine. As more antimicrobial compounds were discovered, it was predicted that infectious diseases would be eliminated through the use of these antimicrobials. Unfortunately, the development of bacterial resistance to these antimicrobials quickly diminished this optimism and resulted in the need for physicians to request the microbiology lab to test a patient’s pathogen against various concentrations of a given antimicrobial to determine susceptibility or resistance to that drug. The original method of determining susceptibility to antimicrobials was based on broth dilution methods, which although still the gold standard today, are time consuming to perform.
This prompted the development of a disk diffusion procedure for the determination of susceptibility of bacteria to antimicrobials. Many researchers published variations for the procedure resulting in multiple protocols that resulted in widespread confusion. Kirby and his colleague, A. W. Bauer, consolidated and updated all the previous descriptions of the disk diffusion method and published their findings. This publication led the World Health Organization to form a committee in 1961 to lay the groundwork for the development of a standardized procedure for single antimicrobial disk susceptibility testing.
Purpose
The purpose of the Kirby-Bauer disk diffusion susceptibility test is to determine the sensitivity or resistance of pathogenic aerobic and facultative anaerobic bacteria to various antimicrobial compounds in order to assist a physician in selecting treatment options for his or her patients. The pathogenic organism is grown on Mueller-Hinton agar in the presence of various antimicrobial impregnated filter paper disks. The presence or absence of growth around the disks is an indirect measure of the ability of that compound to inhibit that organism.
Theory
When a 6-mm filter paper disk impregnated with a known concentration of an antimicrobial compound is placed on a Mueller-Hinton (MH) agar plate, immediately water is absorbed into the disk from the agar. The antimicrobial begins to diffuse into the surrounding agar. The rate of diffusion through the agar is not as rapid as the rate of extraction of the antimicrobial out of the disk, therefore the concentration of antimicrobial is highest closest to the disk and a logarithmic reduction in concentration occurs as the distance from the disk increases. The rate of diffusion of the antimicrobial through the agar is dependent on the diffusion and solubility properties of the drug in MH agar and the molecular weight of the antimicrobial compound. Larger molecules will diffuse at a slower rate than lower molecular weight compounds. These factors, in combination, result in each antimicrobial having a unique breakpoint zone size indicating susceptibility to that antimicrobial compound.If the agar plate has been inoculated with a suspension of the pathogen to be tested prior to the placing of disks on the agar surface, simultaneous growth of the bacteria and diffusion of the antimicrobial compounds occurs. Growth occurs in the presence of an antimicrobial compound when the bacteria reach a critical mass and can overpower the inhibitory effects of the antimicrobial compound. The estimated time of a bacterial suspension to reach critical mass is 4 to 10 hours for most commonly recovered pathogens, but is characteristic of each species, and influenced by the media and incubation temperature. The size of the zone of inhibition of growth is influenced by the depth of the agar, since the antimicrobial diffuses in three dimensions, thus a shallow layer of agar will produce a larger zone of inhibition than a deeper layer.The point at which critical mass is reached is demonstrated by a sharply marginated circle of bacterial growth around the disk. The concentration of antimicrobial compound at this margin is called the critical concentration and is approximately equal to the minimum inhibitory concentration obtained in broth dilution susceptibility tests.
Zone size observed in a disk diffusion test has no meaning in and of itself. The interpretation of resistance and susceptibility to antimicrobials is determined through in vivo testing of blood and urine to calculate the obtainable level of a given antimicrobial that results in resolution of an infection. This information is correlated with zone sizes resulting in the interpretive standards.
The current interpretation standards can be found in the Clinical Laboratory Standards Institute Performance Standards for Antimicrobial Disk Susceptibility Tests: Approved Standards 9th Edition or at European Committee on Antimicrobial Susceptibility Testing.
THE FIRST DAY
Recipe
Sterile saline in 2-ml tubes
18- to 24-hour old pure culture of the organism to be testeda
Mueller-Hinton agar.
MH agar is considered the best medium to use for routine susceptibility testing of nonfastidious bacteria for the following reasons:
Antibiotic susceptibility disks.
Antimicrobial disks can be purchased from any reputable suppliers. They are packaged in spring-loaded cartridges containing 25 or 50 disks and can be ordered as individual cartridges or in packages of 10 cartridges. Proper storage of these disks is essential for reproducible results. Semiautomatic disk dispensers are available from companies such as Remel and BD BBL.
McFarland standard.
McFarland standards are suspensions of either barium sulfate or latex particles that allow visual comparison of bacterial density (Fig. 1). Commercially prepared standards are available for purchase from companies such as Remel or BD BBL. These often include a Wickerham card, which is a small card containing parallel black lines. A 0.5 McFarland standard is equivalent to a bacterial suspension containing between 1 x 10⁸ and 2 x 10⁸ CFU/ml of E. coli. As the student adds bacterial colonies to the saline in the “preparation of the inoculum” step of the procedure, he or she should compare the resulting suspension to the McFarland standard. If the bacterial suspension appears lighter than the 0.5 McFarland standard, more organisms should be added to the tube from the culture plate.
PROTOCOL
Preparation of Mueller-Hinton plate
Appropriately label each MH agar plate for each organism to be tested.
Preparation of inoculum
Inoculation of the MH plate
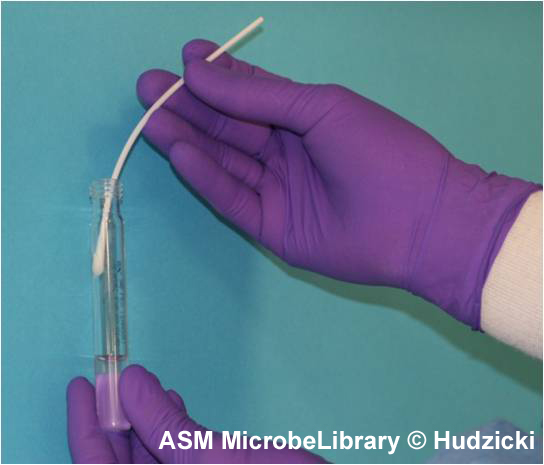
FIG. 2. Kirby-Bauer disk diffusion susceptibility test protocol, inoculation of the test plate. Step 2. Rotate the swab against the side of the tube while applying pressure to remove excess liquid from the swab prior to inoculating the plate.
 A
|
 B
|
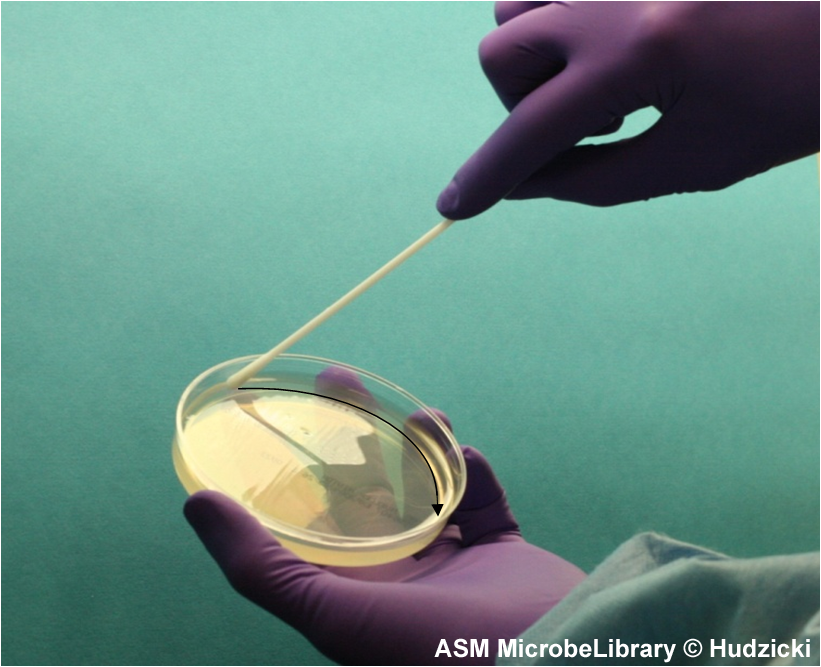
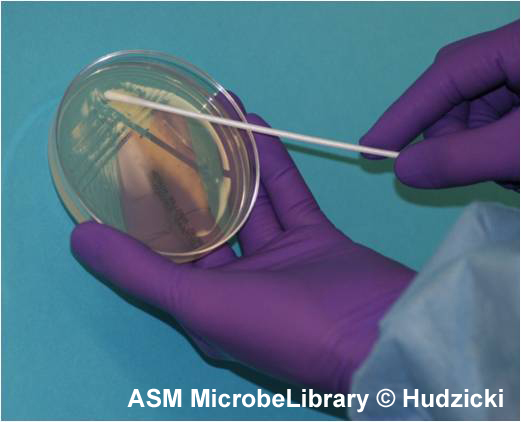
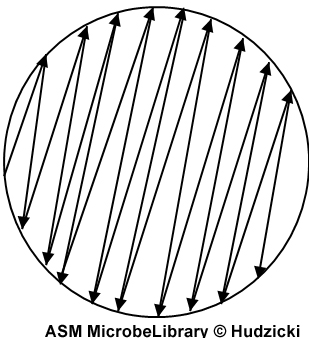
FIG. 4. Kirby-Bauer disk diffusion susceptibility test protocol, inoculation of the Mueller-Hinton agar plate. Step 4. After streaking the Mueller-Hinton agar plate as described in Step 3, rim the plate with the swab by running the swab around the edge of the entire the plate to pick up any excessive inoculum that may have been splashed near the edge. The arrow indicates the path of the swab.
Placement of the antibiotic disks
|
|
 B B |
 C C |
Incubation of the plates
A temperature range of 35°C ± 2°C is required. Results can be read after 18 hours of incubation.
Measuring zone sizes
 A A |
 B B |
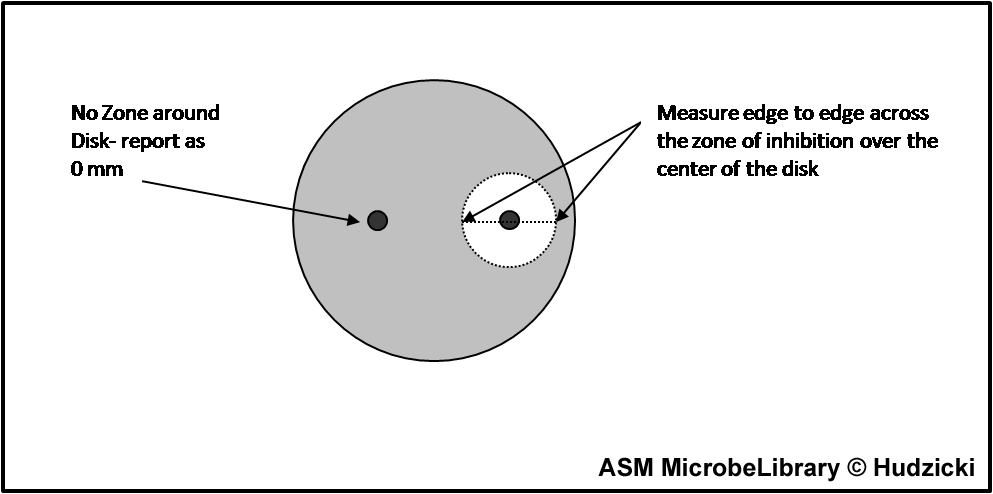
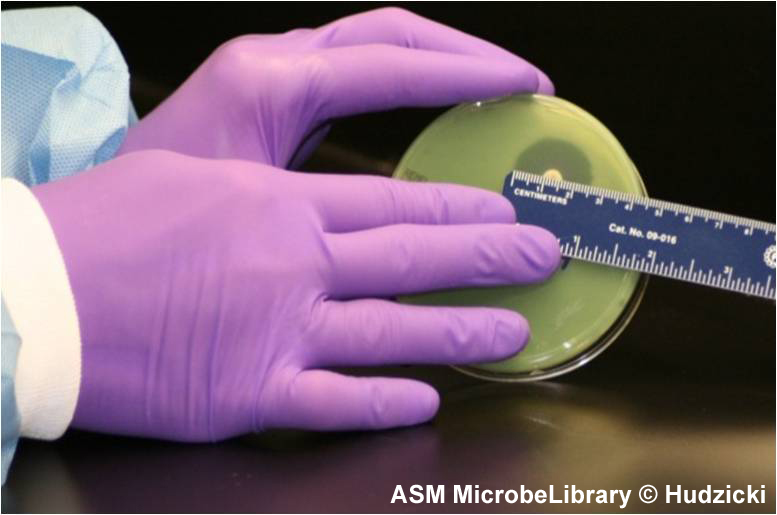
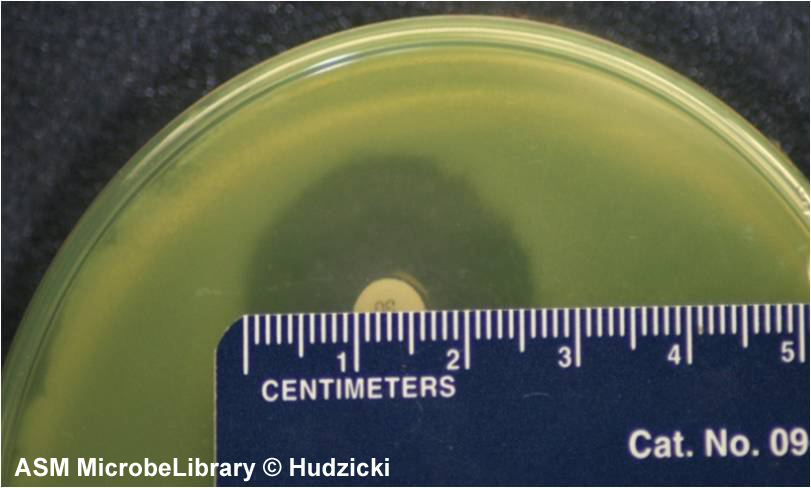
FIG. 7. Kirby-Bauer disk diffusion susceptibility test protocol, measuring zone sizes.
(A) Using a ruler or caliper measure each zone with the unaided eye while viewing the back of the petri dish. Hold the plate a few inches above a black, nonreflecting surface illuminated with reflected light.
(B) The size of the zone for this organism-antibiotic combination is 26 mm.
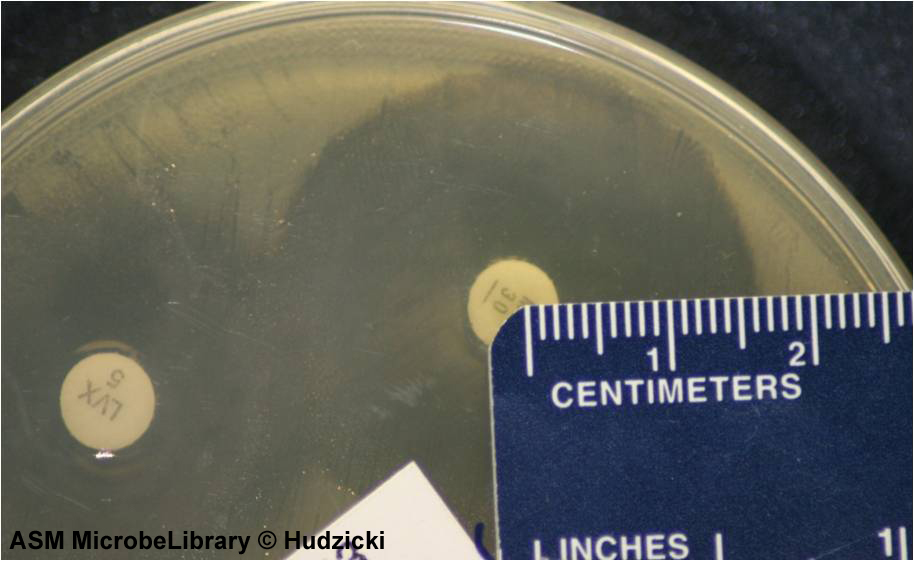
FIG. 8. Kirby-Bauer disk diffusion susceptibility test protocol, measuring zone sizes; an alternate method for measuring zones.
If the zones of adjacent antibiotic disks overlap, the zone diameter can be determined by measuring the radius of the zone. Measure from the center of the antibiotic disk to a point on the circumference of the zone where a distinct edge is present. Multiply this measurement by 2 to determine the diameter of the zone of inhibition. In this example, the radius of the zone is 16 mm. Multiply this measurement by 2 to determine the zone size of 32 mm for this organism-antibiotic combination.
Measuring zone sizes
If the plate was properly inoculated and all other conditions were correct, the zones of inhibition should be uniformly circular and there will be a confluent lawn of growth.If individual colonies are apparent across the plate, the inoculum was too light and the test must be repeated.The zone margin should be considered the area showing no obvious, visible growth that can be detected with the unaided eye. Do not use a magnification device to observe zone edges.
Interpretation and Reporting of the Results
Using the published EUCAST guidelines, determine the susceptibility or resistance of the organism to each drug tested (Table 1).
For each drug, indicate on the recording sheet whether the zone size is susceptible (S), intermediate (I), or resistant (R) based on the interpretation chart.
The results of the Kirby-Bauer disk diffusion susceptibility test are reported only as susceptible, intermediate, or resistant. Zone sizes are not reported to physicians.
|
Enterobacteriaceae |
EUCAST Clinical Breakpoint Table v. 5.0, valid from 2015-01-01 Disk diffusion (EUCAST standardised disk diffusion method) Medium: Mueller-Hinton agar Inoculum: McFarland 0.5 Incubation: Air, 35±1ºC, 18±2h Reading: Read zone edges as the point showing no growth viewed from the back of the plate against a dark background illuminated with reflected light. Quality control: Escherichia coli ATCC 2592 |
|||||
| E-test | Disks | |||||
|
|
|
|||||
|
|
||||||
|
Penicillins |
MIC breakpoint (mg/L)
|
Disk content (µg) |
Zone diameter breakpoint (mm)
|
|||
|
Sensitive |
Resistant > |
Sensitive |
Resistant < |
|||
|
Ampicillin |
8 |
8 |
10 |
14 |
14 |
|
|
Amoxicillin-clavulanic acid |
8 |
8 |
20-10 |
19 |
19 |
|
|
Carbapenems |
MIC breakpoint (mg/L)
|
Disk content (µg) |
Zone diameter breakpoint (mm)
|
|||
|
Sensitive |
Resistant > |
Sensitive |
Resistant < |
|||
|
Imipenem |
2 |
8 |
10 |
22 |
16 |
|
|
Aminoglycosides |
MIC breakpoint (mg/L)
|
Disk content (µg) |
Zone diameter breakpoint (mm)
|
|||
|
Sensitive |
Resistant > |
Sensitive |
Resistant < |
|||
|
Gentamicin |
2 |
4 |
10 |
17 |
14 |
|
|
Miscellaneous agents |
MIC breakpoint (mg/L)
|
Disk content (µg) |
Zone diameter breakpoint (mm)
|
|||
|
Sensitive |
Resistant > |
Sensitive |
Resistant < |
|||
|
Nitrofurantoin (uncomplicated UTI only) |
64 |
64 |
100 |
11 |
11 |
|
|
Trimethoprim (uncomplicated UTI only) |
2 |
4 |
5 |
18 |
15 |
|
Table 1. EUCAST. Six disks. From Clinical Breakpoint Table, Enterobacteriaceae. Complete table for Enterobacteriaceae can be downloaded here.
Introduction
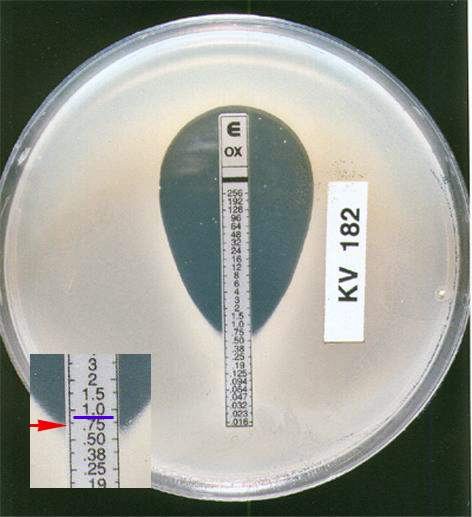
The E test (also known as the Gradinet Diffusion Method) is based on the same principle as the disk diffusion method. It is an in vitro method for quantitative antimicrobial susceptibility testing whereby a preformed antimicrobial gradient from a plastic-coated strip diffuses into an agar medium inoculated with the test organism. The MIC is read directly from a scale on the top of the strip at a point where the ellipse of organism growth inhibition intercepts the strip.
Materials
Procedures
Interpretation
A “susceptible” result indicates that the patient's organism should respond to therapy with that antibiotic using the dosage recommended normally for that type of infection and species. Conversely, an organism with a MIC or zone size interpreted as “resistant” should not be inhibited by the concentrations of the antibiotic achieved with the dosages normally used with that drug. An “intermediate” result indicates that a microorganism falls into a range of susceptibility in which the MIC approaches or exceeds the level of antibiotic that can ordinarily be achieved and for which clinical response is likely to be less than with a susceptible strain. Exceptions can occur if the antibiotic is highly concentrated in a body fluid such as urine, or if higher than normal dosages of the antibiotic can be safely administered (eg, some penicillins and cephalosporins). At times, the “intermediate” result can also mean that certain variables in the susceptibility test may not have been properly controlled, and that the values have fallen into a “buffer zone” separating susceptible from resistant strains. Generally, reporting of a category result of susceptible, intermediate, or resistant provides the clinician with the information necessary to select appropriate therapy. Reporting of MICs could aid a physician is selecting from among a group of similar drugs for therapy of infective endocarditis or osteomyelitis, in which therapy is likely to be protracted.
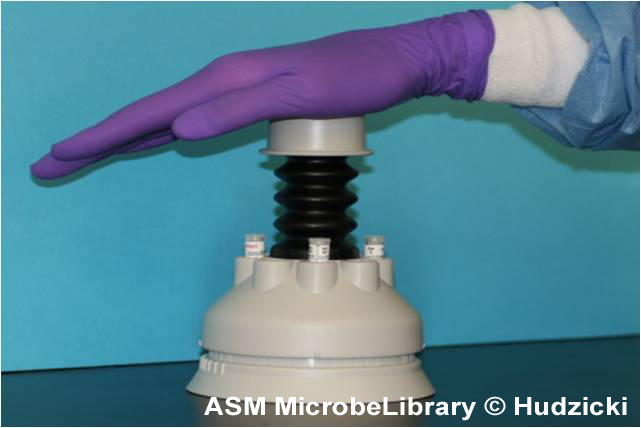
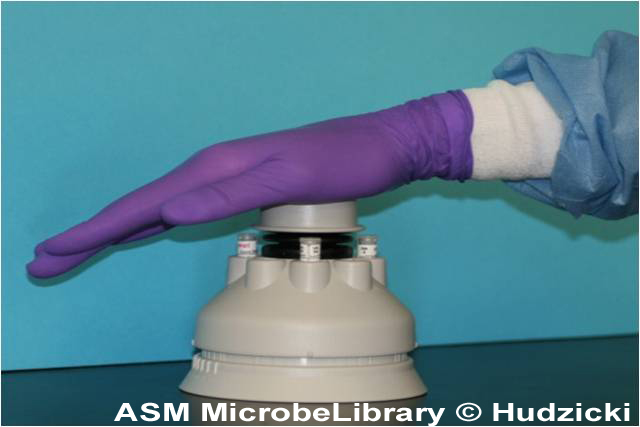
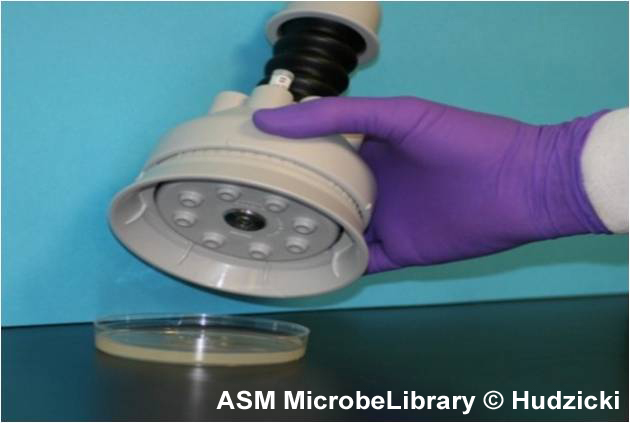
Hand washing
effectiveness.
The human skin contains microbes that reside either in or on the skin and can be residential or
transient. Using an agar contact plate method students will
evaluate different methods of hand disinfection.
THE FIRST DAY:
THE SECOND DAY:
Compare the number of colonies on the agar quarters and explain the
result.
Every year some students fail at the final exam due to poor knowledge of blood
culture. On the
SECOND DAY of practices this method will be explained and shown.
see: http://citeseerx.ist.psu.edu/viewdoc/download?doi=10.1.1.434.8375&rep=rep1&type=pdf
and http://mikrobiologie.lf3.cuni.cz/film/hemokultura.wmv
 A
A